
AUTHOR : JENNY
Introduction
The forex market is fast-paced, and traders need reliable indicators for better decision-making. One such tool is the Moving Average Convergence Divergence (MACD) indicator, widely used in forex trading. For Indian traders, mastering the MACD can improve market trend insights and enhance trading confidence. This blog explains how the MACD works, how to use it effectively, and its strengths and weaknesses.What are some reviews or opinions on FXCC as a forex broker?
What is the MACD Indicator?
The Moving Average Convergence Divergence (MACD) is a momentum indicator that tracks the relationship between two moving averages of a currency pair’s price, helping to identify trends and potential shifts in market direction. Gerald Appel developed the MACD in the late 1970s, and traders primarily use it to identify potential buy and sell signals, momentum, and trend strength.
The MACD is based on two key components:
- MACD Line: The MACD line tracks the momentum of the currency pair.
- Signal Line: The signal line is used to generate trading signals by crossovers with the MACD line.
In addition to these, traders also use the Histogram, which represents the difference between the MACD line and the signal line. The histogram’s size and direction can give traders visual clues about the strength of the trend.
How Does the MACD Work in Forex Trading?
The MACD indicator is versatile and offers various ways to analyze the forex market. Here’s how the MACD works in forex trading:
MACD Line and Signal Line Crossovers
One of the most common ways traders use the MACD is by observing crossovers between the MACD line and the signal line.
- Bullish Crossover: The MACD line crossing above the signal line generates a buy signal, indicating that the price momentum is shifting upward.
- Bearish Crossover: The MACD line crossing below the signal line generates a sell signal, suggesting that downward price momentum is strengthening.
MACD Divergence
Divergence happens when the MACD indicator moves counter to the direction of the price action, signaling a potential reversal in trend. It can signal a potential revrsal in the trend.
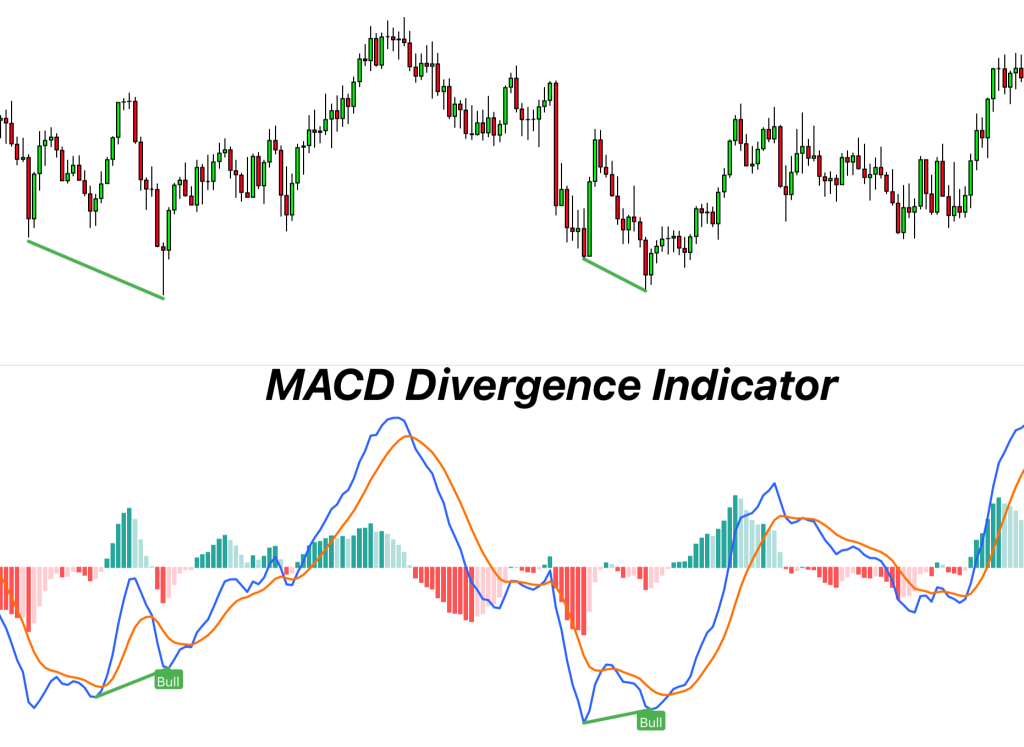
- Bullish Divergence: This happens when the price forms lower lows, but the MACD forms higher lows. It suggests that despite the price making lower lows, the momentum is shifting, and the market may reverse to the upside.
- Bearish Divergence: This occurs when the price forms higher highs, but the MACD forms lower highs. It signals that the uptrend is weakening, and a reversal to the downside might be imminent.
MACD Histogram
A larger histogram means a stronger trend, while a smaller histogram indicates weaker momentum. Traders often look for changes in the histogram’s size to spot potential trend shifts.
- Rising Histogram: A growing histogram above the zero line suggests increasing bullish momentum.
- Falling Histogram: A shrinking histogram below the zero line suggests increasing bearish momentum.
How Can Indian Traders Use MACD in Forex Trading?
For Indian traders[1], using the MACD indicator[2] effectively requires combining it with other tools and strategies to maximize its potential. Here are a few ways to use MACD in forex trading:
Combine MACD with Other Indicators
While the MACD is powehttps://www.britannica.com/money/macd-moving-average-convergence-divergencerful on its own, combining it with other technical analysis tools can improve accuracy. For instance:
- Support and Resistance Levels: Use MACD signals[3] in conjunction with key support and resistance levels to confirm potential breakout or reversal points.
- Relative Strength Index (RSI):Combining the MACD with the RSI helps validate whether a currency pair is overbought or oversold, providing a clearer picture of the trend’s strength.
- Moving Averages: When used alongside simple or exponential moving averages, MACD can offer confirmation of trend direction and help identify potential entry points.
Use MACD for Trend Confirmation
Traders should use the MACD primarily in trending markets, as it helps confirm their position when aligned with the prevailing trend. For example, if the MACD line is above the signal line and both are above the zero line, it indicates an uptrend, and traders can consider long positions.
Watch for MACD Divergence
Divergence between the price action and the MACD line[4] can be a powerful signal of trend reversals. Indian traders can watch for instances of bullish or bearish divergence to anticipate a market shift and take advantage of reversal opportunities.
Risk Management and Stop-Loss
As with any trading strategy[5] risk management is crucial when using MACD. SA stop-loss level could be placed just beyond a recent high or low, providing a cushion against unfavorable price movements.

Pros and Cons of the MACD Indicator
Pros:
- Easy to Understand: The MACD is simple to use, even for beginner traders. Its visual representation through lines and histograms makes it accessible.
- Trend-Following and Momentum Indicator: The MACD not only identifies the trend direction but also highlights momentum changes, helping traders anticipate potential price shifts.
- Versatile: It can be used in conjunction with various other indicators and strategies, enhancing its effectiveness.
Cons:
- Lagging Indicator: As a trend-following tool, the MACD is inherently lagging. It may not signal the beginning of a trend immediately, and by the time it provides a signal, the best entry point could be missed.
- False Signals: The MACD can sometimes produce false signals, especially in choppy or sideways markets, where price action is less clear.
- Requires Confirmation: To improve accuracy and avoid false signals, traders should combine the MACD with other indicators or chart patterns.
Conclusion
The MACD indicator is a valuable tool for forex traders in India, helping to identify trend changes, momentum shifts, and entry/exit points. By understanding MACD crossovers, divergence, and histograms, traders can make informed decisions and manage risk effectively. Combining MACD with other tools and employing proper risk management strategies will enhance trading success.
FAQS
How does MACD work in forex trading?
It helps identify potential buy and sell signals by analyzing crossovers between the MACD line and signal line.
What does a MACD crossover indicate?
A crossover occurs when the MACD line crosses above or below the signal line, signaling potential trend changes.
What is MACD divergence?
MACD divergence happens when the indicator moves in the opposite direction of the price, suggesting a potential reversal.
Can Indian traders use MACD?
Yes, Indian traders can effectively use the MACD on various forex platforms to analyze market trends and momentum.
Which timeframes work best with the MACD?
MACD can be used on any timeframe, but it is most effective in trending markets and when combined with other tools.


+374 95652197