
AUTHOR : SOPHIYA
Introduction
Forex trading, the process of buying and selling currencies to profit from their price fluctuations, has seen significant growth in India in recent years. With more retail traders entering the market, the need for effective trading tools has never been greater. One such powerful tool is the Williams %R indicator, which helps traders identify overbought and oversold conditions in the market, offering critical insights into potential price reversals.
What is the most trusted forex broker in India for beginners? Is OBRinvest a legitimate broker for investing in the stock market and making money online?
What is the Williams %R Indicator?
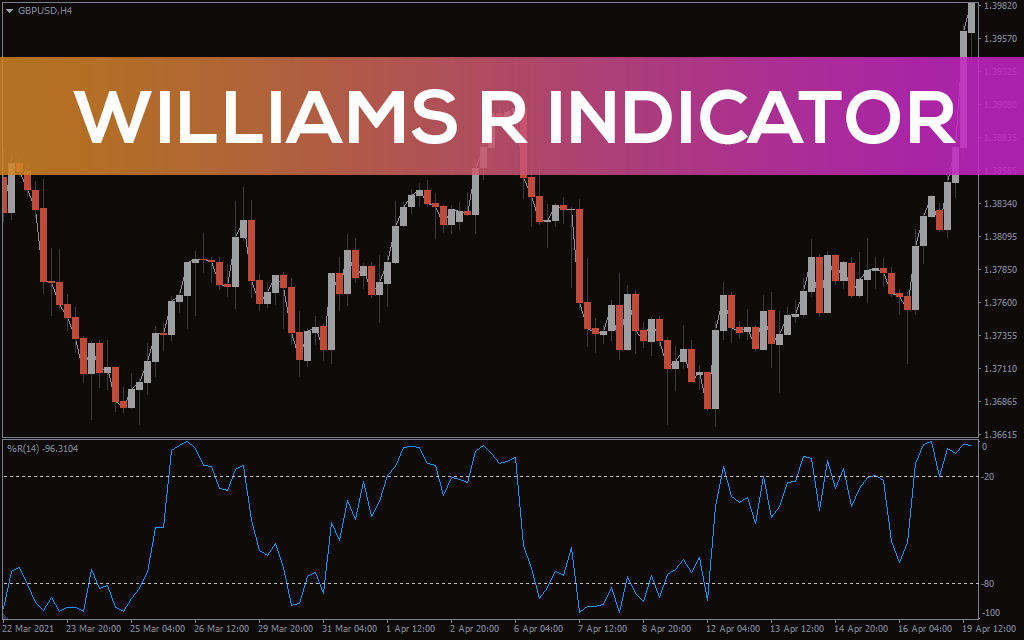
The Williams %R (Williams Percent Range) is a momentum-based technical analysis tool that was developed by Larry Williams in 1973. It tracks the current closing price’s position between the highest high and lowest low over a set period. This indicator is similar to the Relative Strength Index(1) (RSI) but is scaled differently, ranging from 0 to -100. Forex Trading Williams %R Indicator India.
The Williams %R can help traders spot overbought or oversold conditions in the market, which often precede price reversals. A value of 0 means the currency pair is near its highest price, while -100 indicates it’s near its lowest.The Williams %R, typically set to a 14-period default, can be adjusted based on the trader’s strategy and market conditions.
How to Use the Williams %R Indicator in Forex Trading
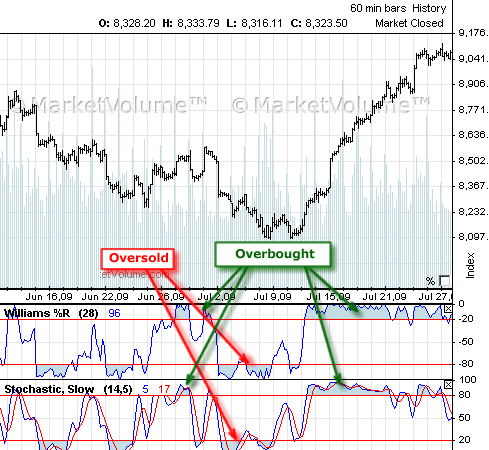
- Identifying Overbought and Oversold Conditions:
- Traders primarily use the Williams %R(2) to spot overbought and oversold conditions in the market. When the indicator rises above -20, it suggests that the market may be overbought and due for a correction. When the indicator drops below -80, it signals that the market has become oversold and may be ready for a rebound. These conditions often precede price reversals, making them key signals for entering or exiting trades.
- Divergence:
- Divergence is a powerful signal for traders(3) using the Williams %R. It occurs when the price moves in one direction, but the Williams %R moves in the opposite direction. For example, if the price is making new highs, but the Williams %R is failing to make new highs, this divergence may suggest that the trend is losing momentum and could soon reverse. Traders in India(4) often use divergence to confirm a potential reversal, making it an important tool for capitalizing on changing market trends.
- Crossing the -50 Line:
- The -50 level is another important threshold in the Williams %R indicator. A reading above -50 suggests that the market is gaining bullish momentum, while a reading below -50 indicates bearish momentum. Traders often watch for crosses above or below the -50 line as a confirmation of trend direction. For example, when the Williams %R crosses above -50, it may signal the start of a bullish trend(5), and traders may consider buying.
- Combining with Other Indicators:
- While the Williams %R is a powerful tool on its own, it is even more effective when used in conjunction with other technical indicators. For example, pairing the Williams %R with the Relative Strength Index (RSI) or moving averages can provide more comprehensive insights into market conditions. For instance, if the Williams %R shows an oversold condition and the RSI confirms a bullish reversal, traders may have a stronger signal to enter a buy trade.
Benefits of Using the Williams %R Indicator
Easy to Understand: The Williams %R is a straightforward indicator, making it accessible even to novice traders. Its clear overbought and oversold levels make it easy to identify potential price reversals.
Helps Identify Market Reversals: One of the key advantages of the Williams %R is its ability to identify market extremes that often precede price reversals. By recognizing these conditions early, traders can enter trades before major price changes occur.
Works Across Timeframes: The Williams %R can be applied to any timeframe, from 1-minute to weekly charts. This versatility makes it suitable for traders in India, whether they engage in short-term intraday trading or longer-term strategies.
Risk Management: The Williams %R helps traders identify overbought and oversold conditions, improving risk management and trade success.
Drawbacks of the Williams %R Indicator

- False Signals: Like any technical indicator, the Williams %R can generate false signals, especially in strong trending markets. In these cases, overbought or oversold conditions may persist for a long time, leading traders to miss out on potential profits.
- Lagging Indicator: Since the Williams %R is based on historical price data, it can sometimes lag behind current market movements. This lag may cause traders to enter or exit trades late, which can reduce the effectiveness of the indicator.
- Over-Reliance: Relying solely on the Williams %R without considering other technical indicators or market factors may lead to poor trading decisions. It is essential to use the Williams %R as part of a broader trading strategy.
Conclusion
The Williams %R indicator helps Forex traders in India identify overbought/oversold conditions and potential price reversals for better trading decisions.While it is easy to use and can be highly effective in various market conditions, it is essential to understand its limitations and use it in combination with other technical analysis tools. Indian traders can use the Williams %R to enhance their Forex strategies and boost success in the dynamic market.
FAQ’s
What is the Williams %R Indicator?
It is a momentum indicator that measures overbought and oversold conditions in the Forex market.
How is Williams %R calculated?
You calculate it by comparing the current price to the highest high over a set period, then scaling it to a range of -100 to 0.
What does Williams %R indicate?
It helps traders identify potential reversal points, with values above -20 indicating overbought and below -80 indicating oversold.
Is Williams %R useful in Forex trading in India?
Forex traders in India widely use it for spotting trend reversals and market extremes.
What timeframes are best for using Williams %R?
It works well across various timeframes, but traders typically use it on 1-hour to daily charts.


+374 95652197