AUTHOR : SIMON DRAVIS
Introduction
Forex trading[1] is a thrilling yet challenging venture for traders around the world, including in India. One of the key elements of successful trading is understanding price patterns and volatility. Among these, volatility contraction patterns have gained considerable attention due to their predictive value and ability to forecast breakout movements. In this guide, we’ll explore volatility contraction patterns, how to spot them in the forex market, and how traders in India can use them to enhance their trading strategies.
What is a Volatility Contraction Pattern?
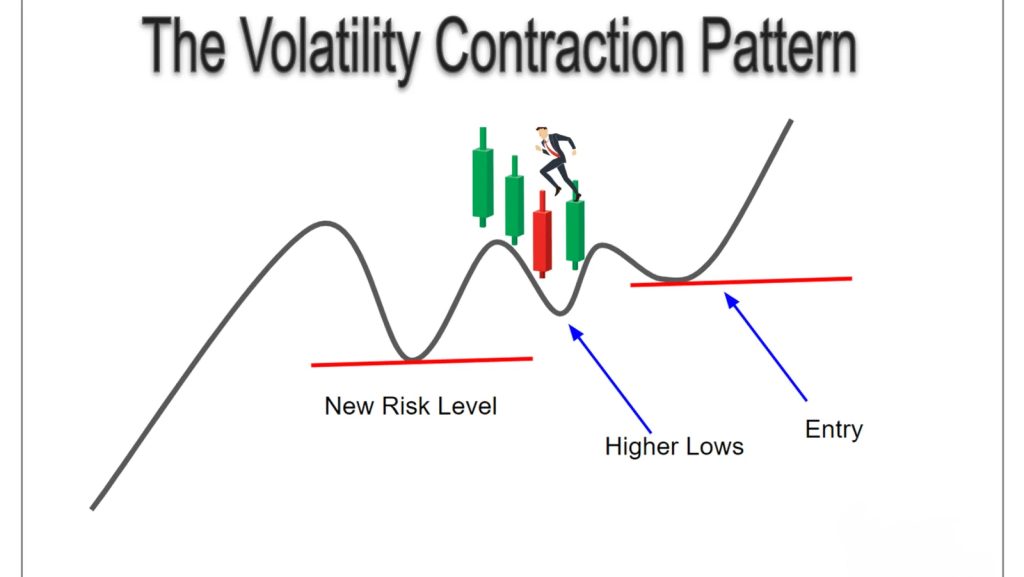
A volatility contraction pattern[2] (VCP) refers to a specific chart pattern where the price of an asset (in this case, a currency pair) experiences a period of decreasing volatility. During this phase, price swings become smaller, and the range of movement contracts, creating a tightening pattern in the chart.
The contraction[3] phase often signals that the market is preparing for a breakout. After the contraction, the price typically breaks out in one direction, either upward or downward, often with strong momentum. This breakout is often the beginning of a significant move, making VCPs a highly valuable pattern for forex traders.
Why are Volatility Contraction Patterns Important in Forex Trading?
- Predicting Breakouts: The most significant value of a volatility contraction pattern lies in its ability to predict breakouts. When the price contracts within a tight range, it indicates that market participants are in a state of indecision. However, once the price breaks out of this range, it is usually with strong momentum, offering a profitable trading opportunity.
- Identifying High-Probability Trades: Volatility contraction patterns often lead to high-probability trades because they are based on the concept of price consolidating before a breakout. Traders can use these patterns to anticipate where the price might break out, allowing them to enter the market with more confidence.
- Effective Risk Management: VCPs can help traders set tighter stop-loss levels due to the tight price range formed during contraction. Since breakouts often lead to strong trends, it’s possible to capture larger moves while managing risk effectively.
How to Identify Volatility Contraction Patterns in Forex?
Spotting a volatility contraction pattern involves recognizing specific chart characteristics. Here’s how you can identify one in the forex market[4]:
1. Price Consolidation Phase
The first sign of a volatility contraction pattern is a period of price consolidation. During this phase, the price moves within a defined range, typically becoming tighter with each swing. The overall range narrows as volatility[5] decreases.
2. Decreasing Price Swings
The second feature of a VCP is the gradual reduction in the size of price swings. The price highs and lows become more closely aligned, showing reduced volatility.
3. Formation of Tight Price Ranges
As volatility contracts, price action forms a series of smaller bars or candlesticks. This is a visual representation of the tightening of the market. The range from the highest price point to the lowest price point narrows with each successive bar.
4. Breakout
The final and most important feature of a volatility contraction pattern is the breakout. After a period of contraction, the price will eventually break out of the defined range, often with strong momentum. This breakout is the signal to take action, as it typically leads to a trend reversal or continuation.
Types of Volatility Contraction Patterns
There are a few common types of volatility contraction patterns that traders should familiarize themselves with:
1. Symmetrical Triangle
A symmetrical triangle is one of the most popular VCPs. In this pattern, the price action forms a series of lower highs and higher lows, creating a symmetrical triangular shape on the chart. As the price approaches the apex of the triangle, the volatility continues to decrease until the breakout occurs.
2. Ascending Triangle
An ascending triangle forms when the price creates a series of higher lows while facing resistance at a horizontal price level. This results in a narrowing of the price range. The breakout typically occurs to the upside, as the price breaks through the resistance level.
3. Descending Triangle
A descending triangle is the opposite of the ascending triangle, where the price creates lower highs while finding support at a horizontal price level. This creates a contracting price range, and the breakout is often to the downside when the price breaks through the support level.
4. Flag and Pennant Patterns
Flags and pennants are also considered volatility contraction patterns. These patterns usually appear after a strong price move and show a brief consolidation before the price continues in the direction of the original trend. Flags appear as rectangular-shaped consolidations, while pennants form small triangles.
How to Trade Volatility Contraction Patterns in Forex Trading
1. Wait for the Breakout
The key to trading volatility contraction patterns is to wait for the breakout. This means you should not enter the market during the contraction phase itself, as the price is moving in a tight range. Instead, wait for the price to break out of the pattern and use that breakout as your entry point.
2. Confirm the Breakout with Volume
Volume is a crucial factor in confirming the validity of a breakout. Ideally, a breakout should be accompanied by an increase in volume, signaling that the move is supported by market participants. Without volume, the breakout may be weak and lead to a false signal.
3. Set Stop-Loss Orders
Since volatility contraction patterns are known to break out with significant momentum, it is important to manage risk by setting a stop-loss order. Place your stop-loss order just outside the pattern’s range, either above or below the breakout point, depending on the direction of the trade.
4. Take Profit Targets
Once the breakout occurs, consider setting a take-profit target based on the distance from the breakout point to the opposite side of the contraction range. This distance can act as a guide to where the price might head after the breakout.
Benefits of Using Volatility Contraction Patterns in the Indian Forex Market
- Adaptability to Different Market Conditions: Volatility contraction patterns are effective in both trending and sideways markets. Whether the Indian forex market is trending strongly or consolidating, these patterns can help traders spot breakout opportunities.
- Ideal for Indian Traders: With the rise of online forex trading in India, traders are increasingly adopting various strategies to improve profitability. Volatility contraction patterns offer Indian traders a clear and reliable method to predict significant market moves.
- Minimized Risk Exposure: The tight price range in a volatility contraction pattern provides a clearer risk management strategy. Traders can set tighter stop-loss orders, which helps to minimize risk while still offering substantial profit potential.
Conclusion
Volatility contraction patterns are powerful tools for forex traders, especially in the dynamic Indian forex market. By recognizing the signs of tightening price action and waiting for a breakout, traders can identify high-probability trade opportunities. Proper risk management and the use of volume as confirmation can further increase the chances of success. Whether you’re a beginner or an experienced trader, incorporating volatility contraction patterns into your forex strategy can enhance your trading outcomes and help you navigate the complex world of currency trading.
FAQ
1. How long does a volatility contraction pattern take to form?
The duration of a volatility contraction pattern can vary, but it generally forms over several days or weeks, depending on the timeframe being used. It is essential to remain patient during the consolidation phase, as breakouts can take time to materialize.
2. Can I use volatility contraction patterns on all currency pairs?
Yes, volatility contraction patterns can be applied to any currency pair, but they tend to work best on highly liquid pairs like USD/INR, EUR/USD, and GBP/USD, which have substantial trading volume and volatility.
3. How can I differentiate between a true breakout and a false breakout?
One way to confirm a true breakout is by checking the volume accompanying the breakout. A breakout supported by high volume is more likely to be valid. Additionally, wait for the price to maintain momentum after breaking out of the pattern before entering a trade.
4. Is volatility contraction suitable for beginner traders in India?
While volatility contraction patterns can be profitable, they require some experience and patience. Beginner traders in India should first practice identifying these patterns on demo accounts before trading them live.
Contact us


+374 95652197