
AUTHOR : SIMON DRAVIS
Introduction
Forex trading[1] is one of the most popular forms of trading globally, including in India. The dynamic nature of the forex market[2] makes it an attractive option for traders looking to capitalize on currency fluctuations. One of the most effective strategies used by experienced forex traders is multi-timeframe confluence[3], which involves analyzing the same currency pair across multiple timeframes to improve trading accuracy and increase profitability. In this guide, we will explore the concept of multi-timeframe confluence and its significance in forex trading in India.
What is Multi-Timeframe Confluence in Forex Trading?
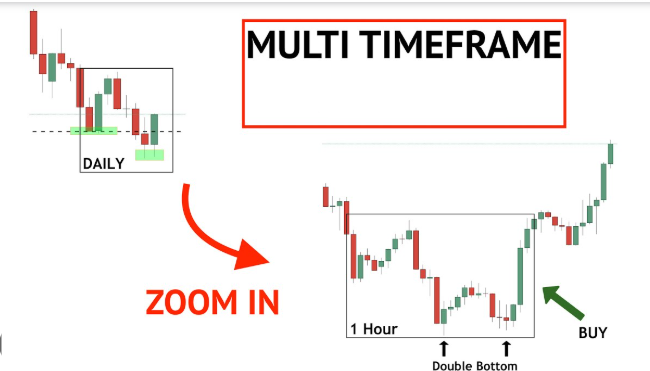
Multi-timeframe[4] confluence refers to the technique of analyzing a currency pair using different timeframes to identify a stronger market trend[5] or better trading opportunities. It involves aligning signals from different charts, such as short-term and long-term timeframes, to enhance the accuracy of trade entries and exits.
For example, a trader might use a 15-minute chart to spot immediate price movements while also analyzing a 1-hour or 4-hour chart for the broader trend. If both timeframes show the same direction or pattern, it increases the likelihood of a successful trade.
Why is Multi-Timeframe Analysis Important?
- Enhanced Accuracy: By looking at multiple timeframes, traders can get a broader perspective of the market, identifying whether short-term trends align with long-term trends. This alignment helps traders avoid false signals and makes the strategy more reliable.
- Better Trade Timing: Multi-timeframe analysis helps traders identify the ideal entry and exit points. A trader may spot a trade on a lower timeframe (like a 15-minute chart) but wait for confirmation from a higher timeframe (like a 1-hour chart) before entering the trade. This ensures the trade has a higher probability of success.
- Risk Management: Multi-timeframe confluence can help in better risk management. When signals on different timeframes align, it is a strong confirmation of the trade’s viability. This reduces the chances of taking unnecessary risks based on unreliable signals.
- Avoiding False Signals: In isolation, a single timeframe might give a misleading signal. However, when signals from different timeframes coincide, it filters out false signals and presents a clearer picture of market sentiment.
How to Implement Multi-Timeframe Confluence in Forex Trading
To effectively use multi-timeframe confluence in forex trading, follow these steps:
Step 1: Select Your Timeframes
Choosing the right timeframes is crucial for successful multi-timeframe analysis. Here are some popular combinations:
- Short-term: 5-minute, 15-minute, 30-minute charts
- Medium-term: 1-hour, 4-hour charts
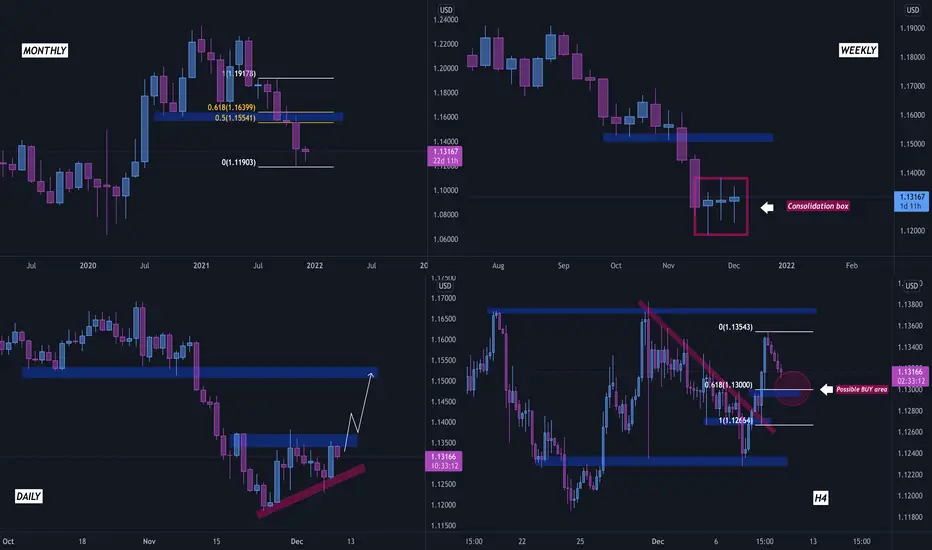
- Long-term: Daily, Weekly charts
For instance, you may use the 15-minute chart for spotting entry points, the 1-hour chart for trend direction, and the daily chart for overall market bias. Each timeframe serves a different purpose, and it’s essential to analyze them in conjunction.
Step 2: Identify the Trend on Higher Timeframes
Before diving into shorter timeframes, identify the overall trend on higher timeframes (1-hour, 4-hour, or daily charts). A trend in the same direction across multiple timeframes provides a stronger indication of the market’s general direction.
For example, if the daily and 1-hour charts show a bullish trend, it may be a good time to look for buying opportunities on a 15-minute chart. A multi-timeframe trend analysis helps you avoid counter-trend trades that are often riskier.
Step 3: Look for Confluence of Indicators
Utilize technical indicators such as moving averages, RSI (Relative Strength Index), or MACD (Moving Average Convergence Divergence) across multiple timeframes. When these indicators show similar signals, such as an overbought condition on both the 1-hour and 15-minute charts, it can reinforce the strength of a potential trade.
For example, a crossover of the moving average on a 15-minute chart, confirmed by a similar crossover on the 1-hour chart, creates a high-probability setup.
Step 4: Analyze Support and Resistance Levels
Support and resistance levels are key aspects of any forex strategy. Analyze price levels on higher timeframes and look for these levels on shorter timeframes as well. When a price level on a higher timeframe aligns with a trend reversal pattern or candlestick formation on a lower timeframe, the confluence between these signals increases the probability of a successful trade.
Step 5: Take Action Based on Confirmation
Once you’ve found confluence on multiple timeframes, wait for confirmation of your trade setup. This could be a candlestick pattern, a breakout, or a shift in momentum on the lower timeframe. Having confluence across multiple timeframes gives traders a higher degree of confidence in the trade.
Benefits of Multi-Timeframe Confluence in Forex Trading in India
- Adapts to Various Market Conditions: The Indian forex market is volatile, and trends can shift rapidly due to domestic and global economic factors. Multi-timeframe analysis allows traders to stay flexible and adapt to changing market conditions.
- Improves Trading Discipline: By waiting for confirmation from multiple timeframes, traders can avoid impulsive trades and stick to their trading plan. This discipline is essential for long-term profitability.
- Aligns with Local Trading Hours: Forex trading in India is often influenced by global market hours. Multi-timeframe analysis helps traders adjust their strategies according to different market sessions, such as the Asian, European, and U.S. sessions, which impact currency pair movements.
Common Mistakes to Avoid in Multi-Timeframe Confluence
- Overcomplicating the Analysis: Too many timeframes and indicators can confuse the trader, leading to analysis paralysis. Stick to a few timeframes and indicators that work best for your strategy.
- Ignoring News Events: Market-moving news, such as RBI announcements or global geopolitical events, can override technical signals. Always factor in economic calendars and news releases when conducting multi-timeframe analysis.
- Trading Against the Trend: While multi-timeframe analysis provides insights into trends, some traders might still try to trade counter to the trend. Avoid this by always respecting the overall trend direction on higher timeframes.
Conclusion
Multi-timeframe confluence is a powerful strategy that enhances forex trading decisions by aligning signals from multiple charts and timeframes. By using this technique, Indian traders can increase their accuracy, improve trade timing, and better manage risk. However, it’s essential to practice and develop a disciplined approach, as success in forex trading also depends on market understanding, patience, and strategic planning.
FAQ
1. Can multi-timeframe confluence work for all currency pairs in the Indian forex market?
Yes, multi-timeframe analysis can be applied to any currency pair. However, the approach works best for liquid pairs, such as USD/INR, EUR/USD, or GBP/USD, which have significant trading volume and volatility.
2. How many timeframes should I use for confluence?
Typically, traders use three timeframes for confluence analysis: a long-term timeframe (like 1 hour or daily), a medium-term timeframe (like 15 minutes or 1 hour), and a short-term timeframe (like 5 minutes or 15 minutes). This combination gives a comprehensive view of the market.
3. How do I choose the right indicators for multi-timeframe analysis?
Popular indicators include moving averages (for trend direction), RSI (for overbought/oversold conditions), and MACD (for momentum). Ensure your indicators align across different timeframes before making any trades.
4. Is multi-timeframe analysis suitable for beginner traders in India?
While multi-timeframe analysis provides a clearer picture of the market, beginners may find it overwhelming at first. It’s advisable to practice on demo accounts before applying the technique in live trading.
5. Can I use multi-timeframe confluence for swing trading in India?
Yes, multi-timeframe analysis is highly effective for swing trading, as it helps identify longer-term trends and ideal entry points on shorter timeframes. This approach aligns perfectly with swing trading strategies.
Contact us


+374 95652197