AUTHOR : JENNY
Introduction
Forex trading in India has grown in popularity due to its accessibility and potential for high returns. With the rise of online trading platforms and the increasing interest in currency markets, Indian traders are exploring various technical indicators to refine their strategies. One of the most widely used tools is the Fibonacci Retracement indicator, which plays a key role in identifying potential price reversal levels.
In this blog, we’ll explore how Fibonacci Retracement works in forex trading and why it’s a powerful tool for Indian traders looking to enhance their trading strategies.
What is Fibonacci Retracement?

Traders use Fibonacci Retracement as a technical analysis tool to identify potential levels of support and resistance in a price trend. The Fibonacci sequence[1]is based on a series of numbers where each number is the sum of the two preceding ones. The key Fibonacci levels[2] in trading are derived from the mathematical ratios found within this sequence.
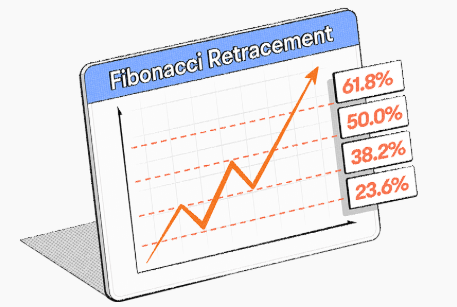
The Fibonacci ratios most commonly used in forex trading are:
- 23.6%
- 38.2%
- 50% (Note: This isn’t a Fibonacci number[3], but traders still use it as a key level.)
- 61.8%
- 100%
These levels represent potential areas where price retracements might occur during an uptrend or downtrend.
How Does Fibonacci Retracement Work in Forex Trading?
Traders place the Fibonacci Retracement tool by drawing a line from the low point to the high point of a price trend (or vice versa, depending on whether the trend is bullish or bearish). The tool then automatically generates horizontal lines at the Fibonacci levels (23.6%, 38.2%, 50%, 61.8%, and 100%) across the price chart.
When the market moves in a particular direction, it rarely moves in a straight line. The price often retraces part of its previous move before continuing in the same direction. Traders use it to identify possible reversal points, where price action might pause or change direction.
Key Fibonacci Levels Explained
- 23.6%: This is the shallowest retracement level and suggests a minor pullback before the price resumes its original trend. It is often seen in strong trends where the market doesn’t correct much.
- 38.2%: Traders often consider this level a more significant retracement, offering a greater chance of price reversal. They commonly use it to identify healthy pullbacks during trends.
- 50%: Traders widely regard this level as an important retracement, though it is not part of the Fibonacci sequence.Many traders believe that after a 50% retracement, price is likely to continue its trend.
- 61.8%Traders closely watch this level, known as the “golden ratio.” They consider it a strong potential reversal point and often mark it as the last major retracement before the price continues its trend.
- 100%: A full retracement, meaning the price has reversed the entire move. Traders use this level to gauge potential reversal zones, and a move to 100% often signals the end of the current trend.
How to Use Fibonacci Retracement in Forex Trading
Fibonacci Retracement is primarily used in forex trading to identify potential entry and exit points. Here’s how to incorporate it into your trading strategy:
Identify the Trend
Before using Fibonacci Retracement, it’s essential to first identify the prevailing market trend—whether it’s an uptrend or a downtrend. In an uptrend, the Fibonacci tool should be drawn from the most recent swing low to the swing high. In a downtrend, draw the Fibonacci tool from the most recent swing high to the swing low.
Place the Fibonacci Levels
Once you’ve identified the trend, place the Fibonacci retracement tool on your chart. The tool will automatically plot horizontal lines at the key Fibonacci levels. These levels represent potential areas where the price may reverse or consolidate.
Look for Price Action at Key Levels
After placing the Fibonacci levels on the chart, wait for price action to reach one of these levels. Watch for signs of price rejection, such as candlestick patterns (e.g., pin bars, engulfing candles) or other indicators[4] like the Relative Strength Index (RSI), to confirm a potential reversal.
Set Entry and Exit Points
Once you’ve identified a potential reversal at a key Fibonacci level, set your entry point. You can enter the market once the price starts to show signs of reversing or after a breakout of the level.
- Stop-Loss: A stop-loss order should be placed just beyond the next Fibonacci level to protect your trade from unexpected market movements.
- Take-Profit: You can set your take-profit levels based on the next Fibonacci level or other key technical levels.
Combine Fibonacci with Other Indicators
While Fibonacci Retracement is a powerful tool, it’s best used in combination with other technical analysis tools. For example, traders often combine Fibonacci with moving averages, trendlines, or oscillators like the RSI or Stochastic Oscillator to confirm trade signals and improve accuracy.
Why Fibonacci Retracement Works in Forex Trading
Fibonacci Retracement works because traders observe the Fibonacci sequence and its ratios in nature and financial markets. Many traders believe that human psychology behind buying and selling follows certain patterns, and these patterns reflect the Fibonacci numbers.
Moreover, the forex market, like all financial markets, tends to move in waves, making the Fibonacci tool [5]useful for spotting pullbacks or retracements during a trend.
Conclusion
Fibonacci Retracement is a valuable tool for forex traders in India to refine strategies and improve accuracy by identifying potential reversal points. While effective on its own, combining it with other analysis tools and proper risk management enhances its effectiveness. Practice and experience are key to mastering Fibonacci levels in trading.
FAQS
What is Fibonacci Retracement?
- It is a technical tool used to identify potential support and resistance levels in price trends.
How does Fibonacci Retracement work in forex?
- It helps traders identify key levels where price reversals or corrections may occur in a trend.
How do I apply Fibonacci Retracement in trading?
- Draw the Fibonacci tool from the trend’s low to high (or vice versa) to plot potential reversal levels.
Can Fibonacci Retracement be used alone?
- It’s most effective when combined with other indicators and tools for confirmation.
What is the best timeframe for Fibonacci Retracement?
- Fibonacci can be applied to any timeframe, but it’s most useful on higher timeframes for more accurate predictions.


+374 95652197