
AUTHOR : JENNY
Introduction
Forex trading in India has become an increasingly popular way to invest, thanks to its accessibility, flexibility, and potential for substantial returns. However, navigating the volatile currency markets requires a solid understanding of technical analysis and the right set of tools. One of the most important tools in any trader’s arsenal is the trading indicator. These indicators help traders analyze market trends, identify entry and exit points, and manage risk.
In this blog, Best forex trading indicators for Indian traders, we will explore some of the best forex trading indicators for Indian traders, breaking down their uses and how they can be applied in the dynamic forex market.Why does Palantir have such bad reviews on Glassdoor?
Moving Averages (MA)

One of the most widely used technical indicators, moving averages help smooth out price action, making it easier to identify trends. In forex trading, two types of moving averages are commonly used:
- Simple Moving Average (SMA): This is the average of a currency pair’s closing prices over a set period. Traders use it to identify the overall direction of the market.
- Exponential Moving Average (EMA): This moving average gives more weight to recent prices, making it more responsive to market changes. Many traders[1] prefer the EMA for quicker trend signals.
How it works:
- Moving averages help determine the prevailing trend by smoothing out price fluctuations, allowing traders to identify the overall market direction.If the price is above the moving average, the market is considered to be in an uptrend; if below, it’s in a downtrend.
- Crossover strategy is popular: when a short-term moving average crosses above a long-term moving average, it signals a buy, and vice versa for a sell signal.
Why it’s useful for Indian traders:
The forex market[2] in India can be volatile, and moving averages help smooth out price fluctuations, allowing traders to focus on the broader trend.
Relative Strength Index (RSI)
- Overbought: RSI above 70, indicating that the market may be overextended and due for a pullback.
- Oversold: RSI below 30, indicating the possibility of an upward reversal.
How it works:
- RSI helps identify potential price reversals by showing when a currency pair is potentially overbought or oversold.
- Traders in India[3] often use the RSI in combination with other indicators, like moving averages, to confirm signals.
Why it’s useful for Indian traders:
RSI is particularly helpful in a highly volatile market like India’s, where price swings can lead to overbought and oversold conditions.
Moving Average Convergence Divergence (MACD)
The MACD is a momentum indicator that shows the relationship between two moving averages—typically a 12-period EMA and a 26-period EMA. Best forex trading indicators for Indian traders ,The MACD is calculated by subtracting the longer moving average from the shorter one.
When the MACD crosses above the signal line, it generates a buy signal, and when it crosses below, it generates a sell signal.
Why it’s useful for Indian traders:
MACD is particularly effective in detecting shifts in momentum, Best forex trading indicators for Indian traders ,making it a great tool for identifying potential trend changes in India’s fast-moving forex market.
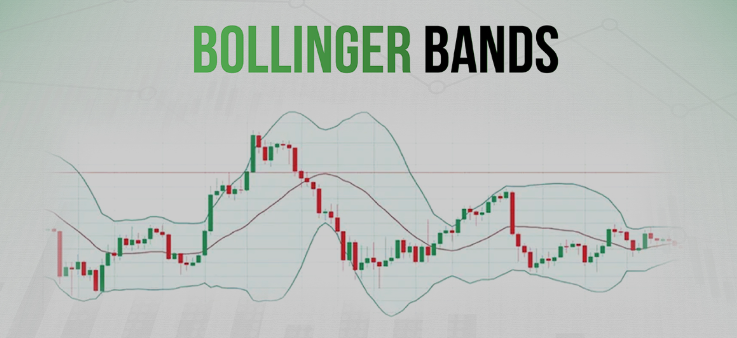
Bollinger Bands
Bollinger Bands are a volatility indicator that consists of a middle band (SMA), an upper band, and a lower band. The upper and lower bands are typically two standard deviations away from the middle band, adapting to changing market volatility.
How it works:
- Band Squeeze: When the bands contract, it indicates lower volatility and suggests a potential breakout or price movement.
- Price Touching the Bands: Prices reaching the upper band signal overbought conditions, while touching the lower band signals oversold conditions.
Why it’s useful for Indian traders:
Bollinger Bands can help traders in India recognize periods of high volatility, often triggered by significant news or market events, allowing them to anticipate potential price moves.
Fibonacci Retracement
The Fibonacci retracement tool is based on the idea that markets move in predictable patterns, with price retracing a predictable portion of a move before continuing in the same direction.
How it works:
- Traders use Fibonacci retracement levels to predict potential areas of support or resistance after a price movement. When the price retraces to one of these levels, it may reverse or continue in the direction of the original trend.
Why it’s useful for Indian traders:
Fibonacci retracement is a popular tool in India’s forex market, especially when trying to predict price pullbacks during volatile periods.
Average True Range (ATR)
The Average True Range (ATR) measures market volatility. It calculates the average range between the highest and lowest prices over a specific period, indicating how much a currency pair typically moves within that time frame.
How it works:
- High ATR values suggest high volatility, and low ATR values indicate low volatility.
- Traders use ATR to determine appropriate position sizes and set stop-loss levels, adjusting for the level of market volatility.
Why it’s useful for Indian traders:
ATR helps Indian traders assess[4] the appropriate risk levels, especially in the face of sudden market movements or economic events that can trigger volatility.
Stochastic Oscillator
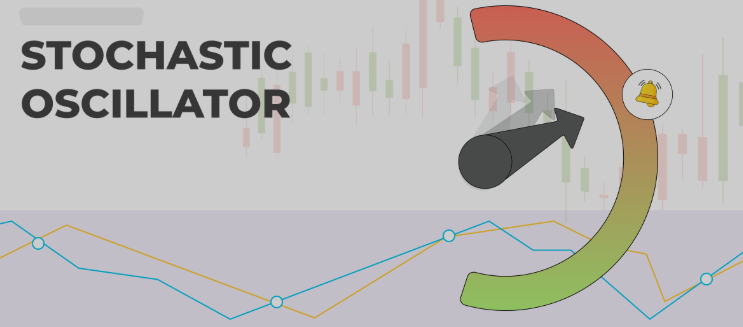
The Stochastic Oscillator is a momentum indicator that compares the current price of a currency pair to its price range over a specific period. It oscillates between 0 and 100, helping traders spot[5] potential overbought or oversold conditions.
How it works:
- Overbought: When the Stochastic Oscillator is above 80, suggesting that the market is potentially overbought.
- Oversold: When the oscillator is below 20, indicating the possibility of a reversal to the upside.
Why it’s useful for Indian traders:
The Stochastic Oscillator is effective for identifying potential turning points in the market, providing traders in India with valuable signals for trade entries and exits.
Conclusion
The right mix of forex indicators helps Indian traders make informed decisions in a volatile market. While each indicator has its advantages, no tool is foolproof. Success comes from combining indicators with solid risk management, continuous learning, and discipline.
FAQS
What are forex trading indicators?
Forex trading indicators are tools that help traders analyze market data to make informed trading decisions.
What is the most popular forex indicator?
The Moving Average (MA) is one of the most popular indicators used to identify trends.
How does the MACD indicator work?
MACD shows the relationship between two moving averages to highlight momentum shifts in the market.
Why use Bollinger Bands in forex trading?
Bollinger Bands help identify volatility and potential price reversals by showing upper and lower price ranges.
How do Fibonacci retracement levels help traders?
Fibonacci retracement levels predict potential support and resistance zones during price pullbacks.


+374 95652197