AUTHOR : JENNY
Introduction
Forex trading is an exciting and lucrative activity, especially in India, where the forex market has seen a surge in participation over the years. With the rise of online platforms and easy access to global markets, more traders are exploring ways to refine their trading strategies. One of the most powerful tools at their disposal is the Stochastic Oscillator.
This tool, a staple in technical analysis, can help traders identify overbought and oversold conditions in the forex market, making it a vital component of any trader’s toolkit. Let’s explore the Stochastic Oscillator and its application in forex trading in India.Why some people write AAFX Trading scam reviews?
What is the Stochastic Oscillator?

The Stochastic Oscillator is a momentum indicator that compares a currency pair’s closing price to its price range over a specific period of time. It measures the velocity of price movements to indicate whether a currency is overbought or oversold.
Developed by George Lane in the late 1950s, the Stochastic Oscillator is based on the premise that prices tend to close near the extremes of their recent trading ranges in trending markets.
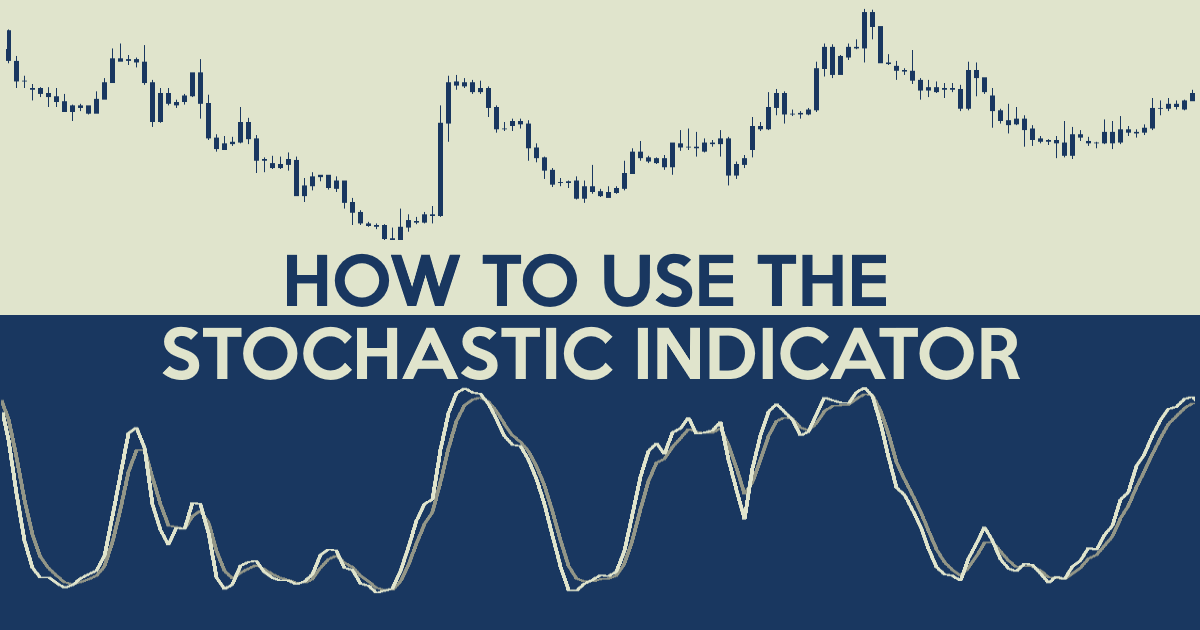
The Stochastic Oscillator consists of two lines:
- %K Line: This is the main line of the oscillator and represents the current closing price relative to the range over a set period.
- %D Line: This is the moving average of the %K line and acts as a signal line for potential trades.
The Stochastic Oscillator is plotted between 0 and 100, with readings above 80 considered overbought, and readings below 20 considered oversold.
Using the Stochastic Oscillator in Forex Trading
The Stochastic Oscillator is used in forex trading to spot potential reversal points by identifying overbought or oversold conditions. Here are some key ways to use this indicator effectively:
Overbought and Oversold Conditions
As mentioned, readings above 80 indicate overbought conditions, while readings below 20 indicate oversold conditions. These levels suggest that the currency pair might be due for a reversal or at least a temporary pullback.
- Overbought (above 80): This is a signal that prices may have moved too high too quickly and might be ready for a downward correction.
- Oversold (below 20): Conversely, when the Stochastic Oscillator shows readings below 20, it signals that the currency pair might have been sold off too much, suggesting the potential for an upward price movement.
Traders watch for these signals closely and often combine them with other indicators or price action to confirm trade entries.
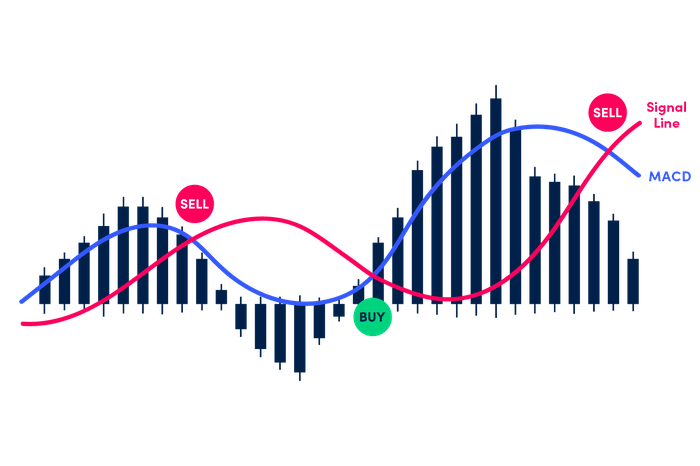
Crossovers
A key trading signal[1] is the crossover between the %K and %D lines.When the %K line crosses above the %D line, traders consider it a bullish signal. Conversely, when the %K line crosses below the %D line, traders consider it a bearish signal. Traders use these crossovers, especially when they happen in overbought or oversold areas, as potential entry or exit points.
- Bullish Crossover: %K crosses above %D when both lines are below 20 (indicating an oversold market). Traders often see this as a strong buy signal.
- Bearish Crossover: %K crosses below %D when both lines are above 80 (indicating an overbought market). Traders see this as a potential sell signal.
Divergence
Another critical concept is divergence, which occurs when the price action is moving in the opposite direction of the Stochastic Oscillator[2]. This can signal a potential reversal. For example:
- Bullish Divergence: When the price makes a new low, but the Stochastic Oscillator does not confirm this by also making a new low, it suggests weakening downward momentum and the possibility of an upward reversal.
- Bearish Divergence: Conversely, when the price makes a new high, but the Stochastic Oscillator fails to make a new high, it suggests that the upward momentum is weakening, and a downward reversal might be imminent.
Combining with Other Indicators
The Stochastic Oscillator is most effective when combined with other technical analysis tools. Many traders use it in conjunction with other momentum indicators, like the Relative Strength Index (RSI), or trend-following indicators, like Moving Averages. By confirming signals from multiple sources, traders can improve the probability of a successful trade.
Why Use the Stochastic Oscillator in Forex Trading in India?
Forex trading in India has gained immense popularity, particularly with the rise of online trading platforms that provide easy access to global markets. Traders in India can benefit significantly from using technical indicators like the Stochastic Oscillator for several reasons:

- Volatile Markets: The Indian forex market[3] can experience high volatility, especially with currency pairs like USD/INR. The Stochastic Oscillator helps traders identify potential reversal points in such fast-moving markets.
- Timing Entries and Exits: With the right use of the Stochastic Oscillator, Indian traders[4] can better time their entries and exits, reducing the risk of premature trades and maximizing profit opportunities.
- Affordable Access to Tools: Many Indian brokers[5] offer low-cost access to powerful trading platforms like MetaTrader 4 (MT4), which include the Stochastic Oscillator as a built-in tool. This makes it easy for traders to incorporate the indicator into their strategy without any additional costs.
- Risk Management: The Stochastic Oscillator is a great tool for risk management. By helping traders spot overbought and oversold conditions, it can guide them in avoiding trades at market extremes, thereby minimizing risk exposure.
Conclusion
The Stochastic Oscillator is an essential tool for forex traders in India looking to optimize their trading strategies. By understanding how it works and using it effectively, traders can identify overbought and oversold conditions, spot crossovers, and analyze divergences. While it is not a perfect indicator on its own, when combined with other analysis tools, it can significantly enhance a trader’s ability to make informed and timely trading decisions.
FAQS
What is the Stochastic Oscillator?
- It is a momentum indicator that helps identify overbought and oversold conditions in the market.
How is the Stochastic Oscillator used in forex trading?
- It is used to spot potential price reversals by analyzing the %K and %D lines and their crossovers.
What is a bullish crossover in the Stochastic Oscillator?
- A bullish crossover occurs when the %K line crosses above the %D line, signaling a potential buy opportunity.
What is a bearish crossover in the Stochastic Oscillator?
- A bearish crossover occurs when the %K line crosses below the %D line, signaling a potential sell opportunity.
How can divergence be used with the Stochastic Oscillator?
- Divergence between price action and the oscillator indicates a potential reversal in market trends.


+374 95652197