
Author: Shin Hari
Introduction
Forex trading[1] is an exciting but highly volatile market, especially in India, where the forex industry has seen rapid growth. One of the most widely used tools by forex traders is technical analysis[2], and among the numerous technical indicators, the Relative Strength Index (RSI) stands out.
This article aims to explore how the RSI forex trading strategy works in India and how traders can use it to their advantage in this fast-paced market. What steps can be taken to retrieve money from a Forex scammer in India
What is RSI (Relative Strength Index)?

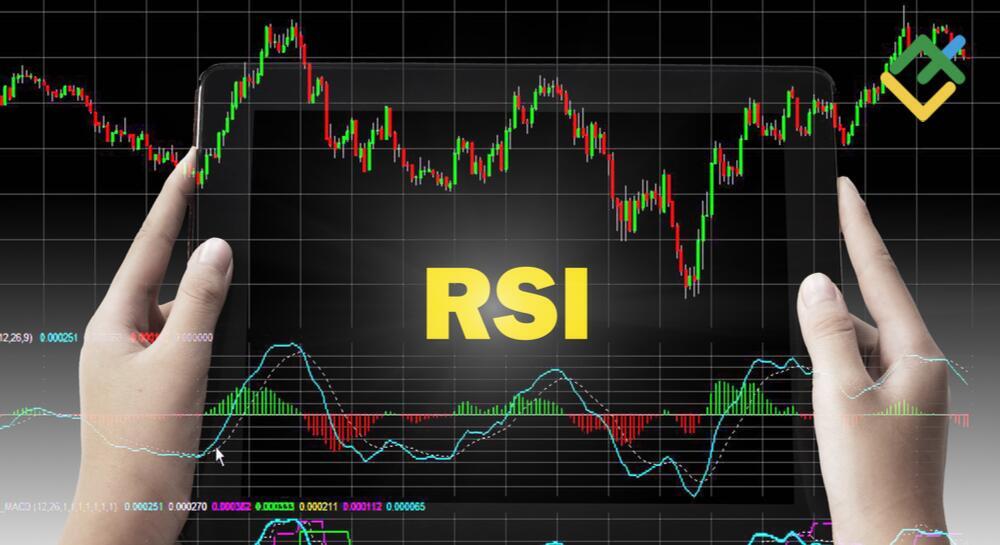
The Relative Strength Index (RSI) is a momentum oscillator that measures the speed and change of price movements. It was developed by J. Welles Wilder in 1978 and is one of the most popular tools for assessing overbought and oversold conditions in the market. RSI oscillates between 0 and 100, where values above 70 indicate overbought conditions, and values below 30 signify oversold conditions.
The calculation of RSI is based on the average gain and loss over a given period, typically 14 periods (could be adjusted according to trading preferences).
Understanding the RSI Forex Trading Strategy
RSI is used to identify trends and potential reversals in the market. When the RSI exceeds the 70-mark, it suggests that the asset might be overbought, indicating a potential selling opportunity. Conversely, when the RSI is below 30, it shows oversold conditions, which could present a potential buying opportunity.
A key concept in RSI trading is RSI divergence[3], where price trends move in the opposite direction of the RSI. This divergence often signals a reversal in market direction.
RSI Trading Strategy: Example of Trade Setup in Indian Forex Market
For example, if you are trading the USD/INR pair and notice that the RSI has risen above 70, indicating an overbought market, you may look for signs of a pullback. If the price starts to drop, this could be your sell signal. Place a stop-loss just above the recent high and a target near the next support level.
RSI Trading Strategies for Beginners
If you are new to RSI trading, you can begin with simpler strategies. A popular strategy for beginners is combining RSI with Simple Moving Averages (SMA). For example, when the RSI crosses above 30 and the price is above the 50-period SMA, it may confirm an upward move.
Additionally, using trendlines and support/resistance levels alongside RSI can enhance your decision-making process. These additional tools help confirm the market’s trend[4] direction and improve the reliability of your RSI signals.
Common Mistakes to Avoid When Trading with RSI
While RSI is a powerful tool, it’s essential to avoid common mistakes that could lead to losses:
- Overreliance on Overbought/Oversold Conditions: Just because the RSI shows overbought or oversold conditions doesn’t mean the market will reverse immediately. Consider the overall trend before making decisions.
- Ignoring Market Conditions and News Events: External factors, such as economic news or geopolitical events, can significantly impact currency prices. It’s crucial to keep an eye on the broader market context when using RSI.
RSI Forex Trading Strategy in the Indian Market Context
India’s forex market is known for its unique characteristics, including the USD/INR, EUR/INR, and GBP/INR pairs, which are highly liquid. The RSI strategy is particularly useful when trading these pairs, especially when focusing on major trends or reversals.
Risk Management Techniques for RSI Traders
Good risk management[5] is critical for long-term success with the RSI strategy. Always set stop-loss orders to protect your trades, and don’t risk more than 1-2% of your trading capital on a single trade. Additionally, keep an eye on the leverage ratio to avoid magnifying losses.

Combining RSI with Other Forex Trading Strategies
For more comprehensive analysis, combine RSI with other tools like MACD (Moving Average Convergence Divergence) and price action strategies. This approach provides a more complete picture of market conditions, increasing the chances of successful trades.
Conclusion
The RSI forex trading strategy is a reliable and simple method for identifying profitable opportunities in India’s forex market. By understanding how to use the RSI indicator effectively, traders can improve their decision-making process, maximize profits, and minimize risks
FAQs
- What is the ideal RSI level for trading in India?
- RSI levels above 70 indicate overbought conditions, and levels below 30 indicate oversold conditions. Traders use these levels to decide entry and exit points.
- Can I use RSI with other technical indicators?
- Yes! Combining RSI with indicators like MACD, moving averages, or support/resistance levels improves the accuracy of your trades.
- How do I avoid false signals when trading with RSI?
- Always confirm RSI signals with other technical indicators or patterns like trendlines, support/resistance, or volume analysis.
- What timeframes should I use for RSI in forex trading?
- For intraday trading, use shorter timeframes like 15-min or 30-min charts. For longer-term trading, use 4-hour or daily charts.
- How can I maximize my profits using the RSI strategy?
- Combine RSI signals with good risk management techniques, like setting proper stop-loss levels, and use it alongside other indicators to confirm entry points.


+374 95652197